
January 29 2026
How Share of Search (SoS) shows early signs of brand growth

Marketing leaders are under more pressure than ever to prove impact, justify investment, and spot shifts in demand before competitors do. Traditional performance metrics still matter, but they often tell you what happened after the fact.
That is why Share of Search (SoS) has become one of the most useful strategic indicators available. Done properly, it helps brands understand competitive momentum, anticipate market share shifts, and identify where future growth is likely to come from.
Below, we explore what share of search is, why it matters in 2026, and how brands can use it as a practical decision-making tool.
What is share of search?
Share of search measures how much of the total search demand in a market is attributed to your brand, compared with competitors.
Put simply, if 100,000 people search for brands in your category this month and 25,000 of those searches are for your brand, your share of search is 25%.
What makes SoS powerful is that it reflects real consumer interest, at scale, in a place where intent is often high: search.
Share of search is closely linked to market share
One of the strongest reasons SoS is so valuable is the evidence behind it.
Studies referenced in the IPA’s Share of Search = Share of Market work show an average correlation of around 83% between share of search and share of market across multiple categories, countries, and languages.
That is remarkably high for any marketing metric, and it means SoS can often act as a proxy for competitive position, especially when market share data is delayed, expensive, or difficult to access.
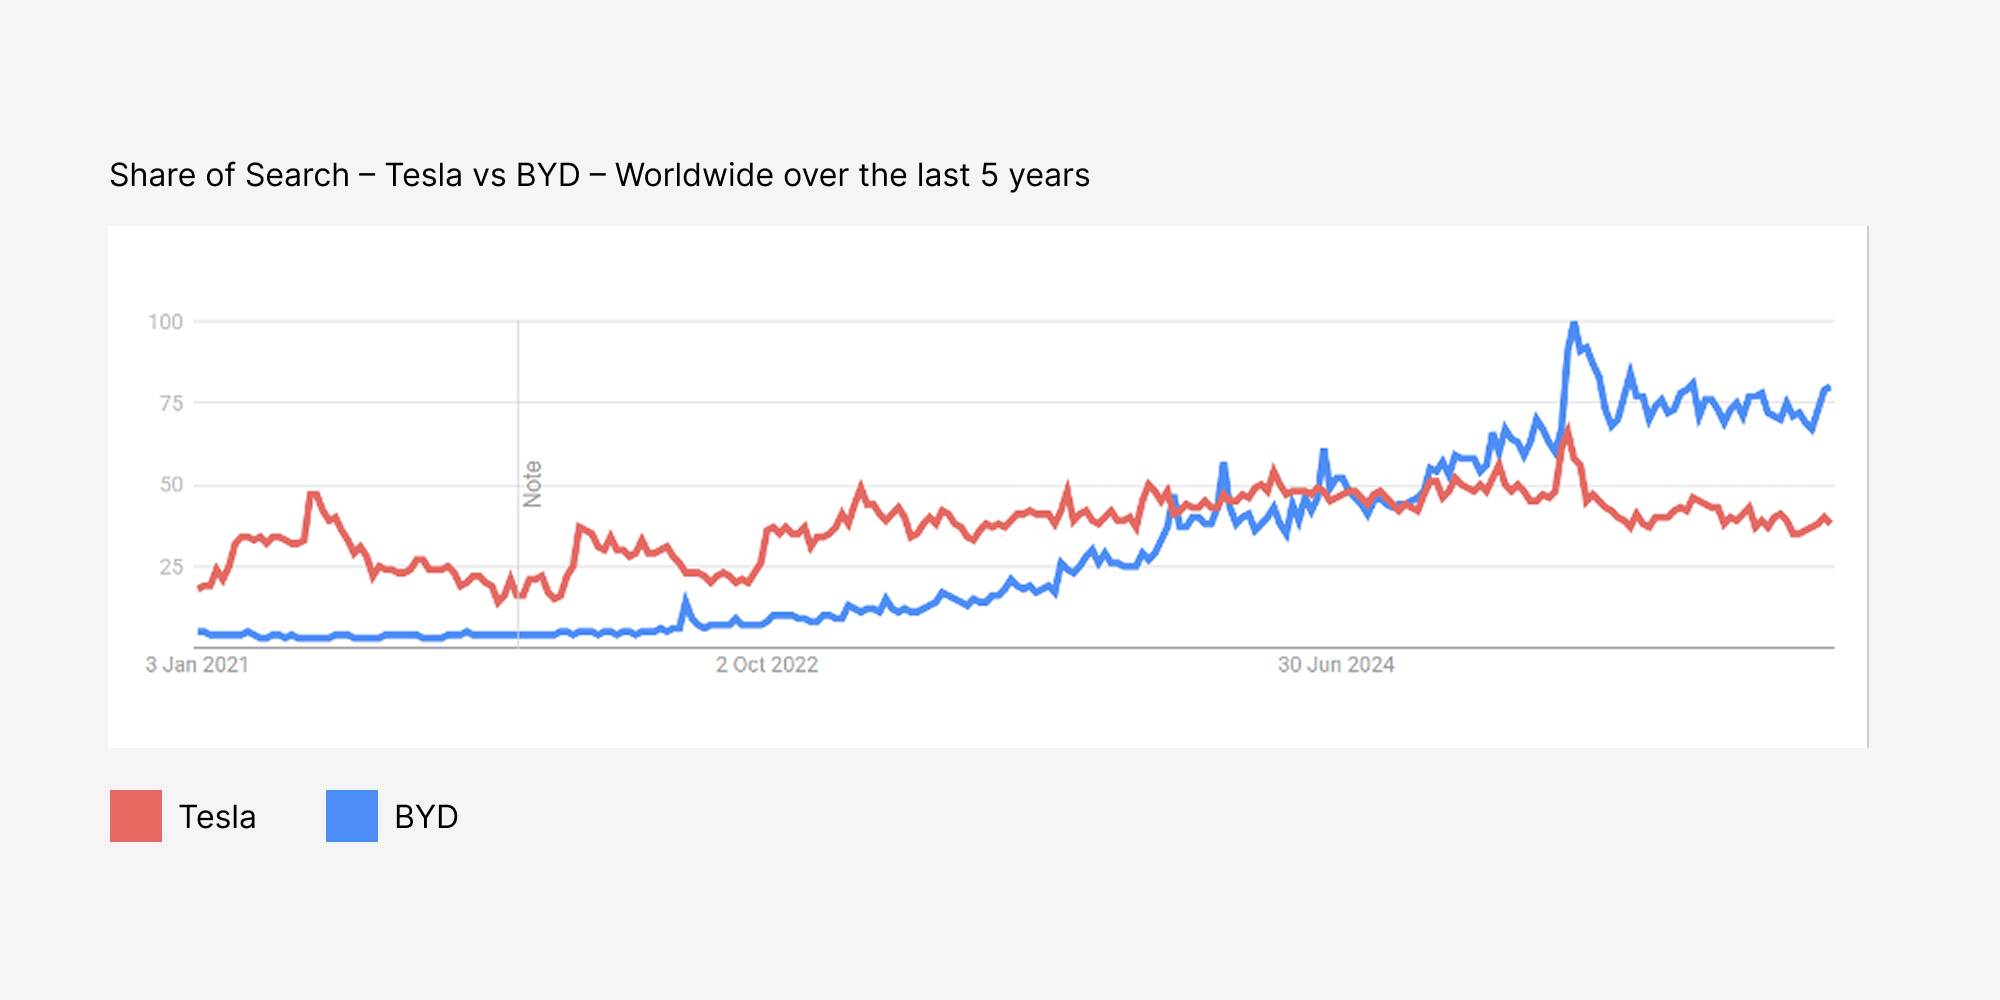
The EV Battle in Search Data
A great example is the battle between BYD and Tesla, which BYD are now winning.
Share of Search predicted this outcome when BYD started to exceed Tesla Share of Search through early 2024 and then went on to beat Tesla.
SoS is a leading indicator, not a lagging one
Many metrics tell you what happened:
Sales data tells you what customers already bought
Market share reporting is often quarterly and slow
Brand tracking surveys take time and can be limited in sample size
SoS is different because it can indicate what is coming next.
When a brand’s SoS rises, its market share typically follows within months. In some sectors (including automotive), SoS can predict market share movements up to 12 months in advance.
That makes SoS an early warning system. If your SoS is falling, it is often a sign that future demand is slipping too, even if current revenue has not yet taken a hit.
Excess SoS helps predict growth (and risk)
The real strategic insight comes when you compare:
Your share of search, and
Your share of market
The gap between these two is known as Excess Share of Search.
Brands with higher SoS than their current market share often gain market share later, making Excess SoS a strong predictor of future growth.
This becomes a useful planning tool:
If your SoS is above your market share, you may be on track for growth
If your SoS is below your market share, you may be vulnerable, and at risk of decline
In 2026, with tighter budgets and more scrutiny on ROI, this kind of insight is extremely valuable for prioritising spend.
Why share of search matters more than ever in 2026
The marketing landscape in 2026 has intensified:
Competition is more aggressive across paid and organic channels
Consumer journeys are fragmented, with more touchpoints before conversion
Search behaviour is evolving, but still remains a core discovery and intent channel
Brands need faster signals to guide decisions in real time
SoS helps because it brings clarity to three critical questions:
Is demand for our category rising or falling?
Are we winning attention vs competitors?
Are we building future market share, or losing it?
Using SoS to track the market and competitors
A major strength of SoS is that it allows you to separate brand performance from broader market changes.
By tracking visibility for your brand alongside competitors and retailers, you can see:
Overall market fluctuations in demand
Whether competitor brands are growing or declining relative to you
The impact of competitor campaigns, pricing changes, or major news events
This helps teams respond faster, particularly when competitor share gains are happening before sales losses show up.
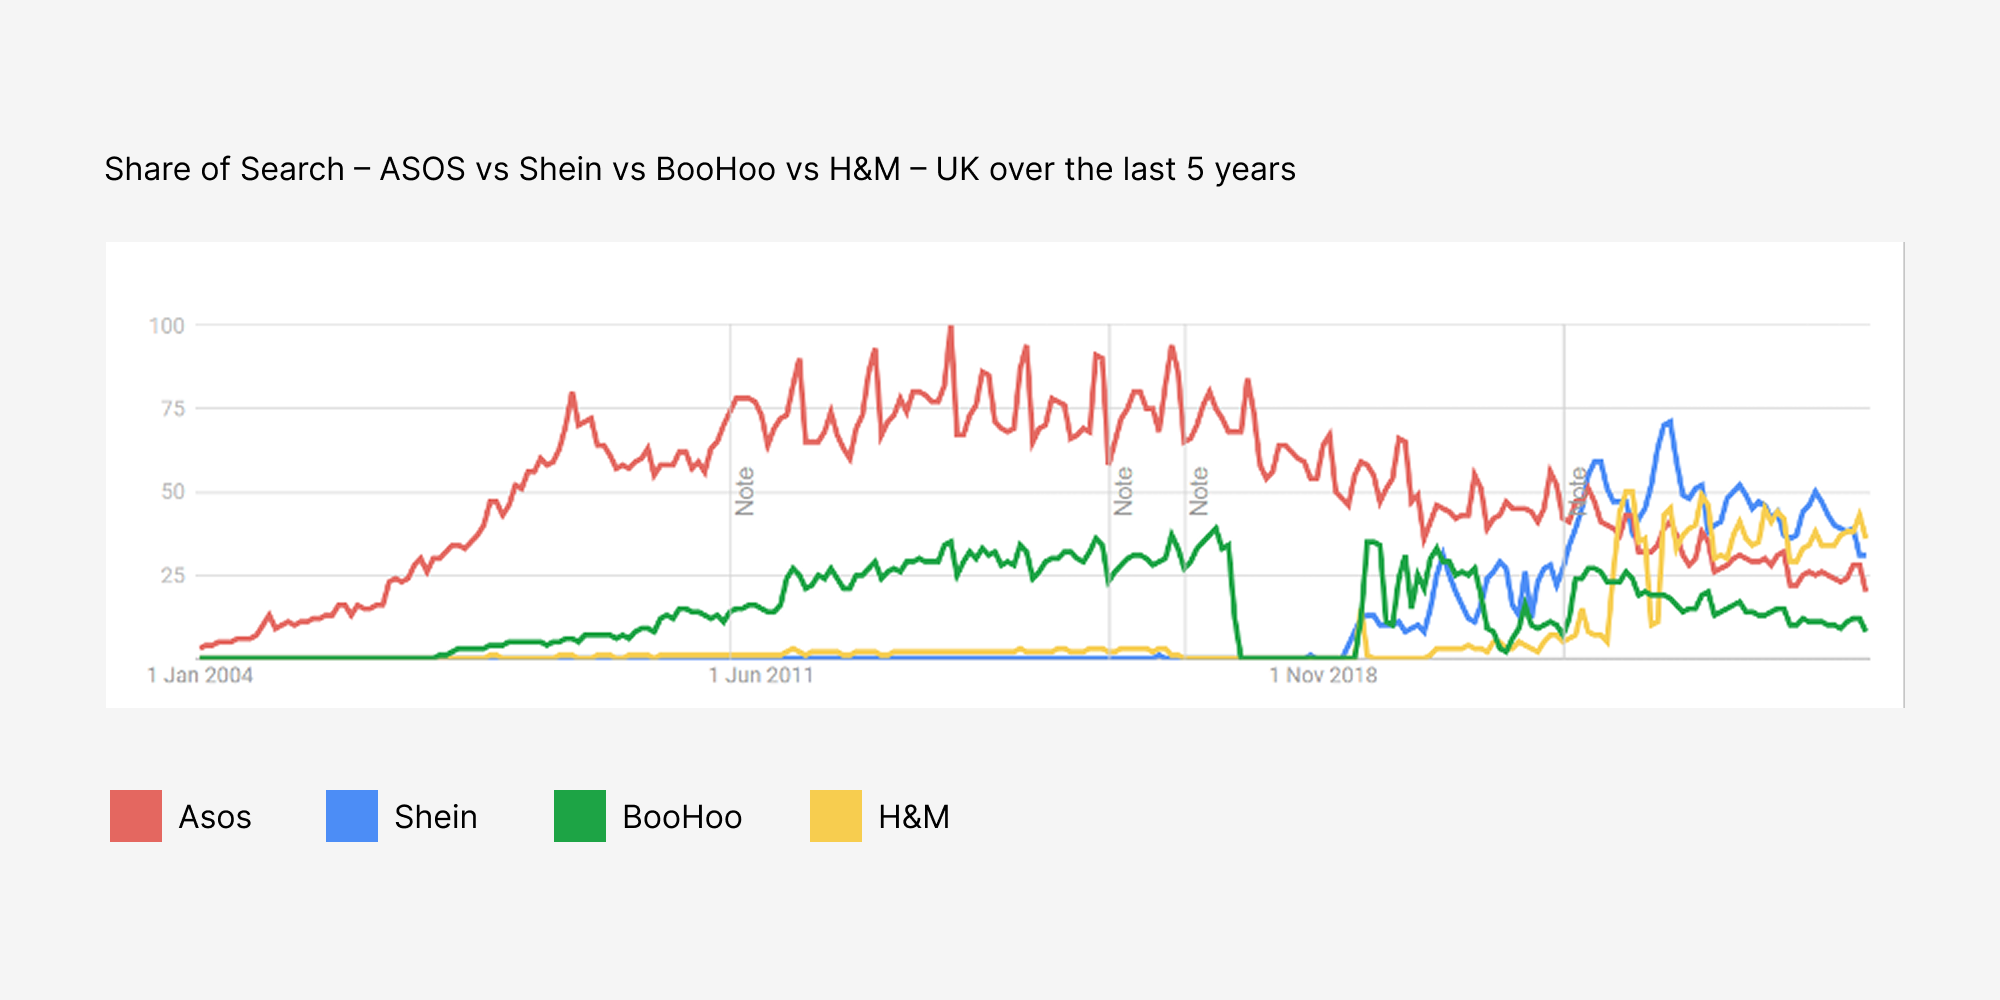
Inside the Online Fashion Power Struggle
The battle for the UK online fashion market has been fierce, and ASOS has lost significant share to Shein and H&M.
Share of Search predicted this outcome when Shein started to exceed ASOS Share of Search through 2023 and 2024.
Connecting SoS to share of voice and performance keywords
Share of search can also be enhanced by layering in share of voice (SoV) across keywords that drive performance, not just brand terms.
This approach typically includes:
Brand share of voice vs competitors across all keywords that drive performance
Share of voice by category, so you can see which product areas are strengthening or weakening
Visibility monitoring for priority commercial terms that influence growth
In practice, this is where SoS becomes highly actionable. You are not just monitoring interest, you are identifying which categories and keyword themes are responsible for the shifts.
Category-level analysis highlights where growth is really happening
In 2026, growth is often uneven across categories. Some parts of a portfolio might be booming while others decline.
A robust SoS approach includes category performance analysis such as:
Category search volume trends
Competitor performance within each category
Movement over time, period vs period, to identify momentum shifts
This allows teams to answer questions like:
Which category is gaining attention fastest?
Are we winning visibility where demand is growing?
Where are competitors starting to dominate?
Social listening adds context to search trends
Search data is powerful, but it becomes even stronger when paired with social listening.
Social listening tracks how much your brand is being talked about vs competitors across social media and discussion forums.
This provides useful context such as:
Why search demand might be spiking (e.g., influencer activity, PR coverage, product issues)
What topics customers associate with your brand
Emerging themes that could shape messaging, content, and product positioning
In 2026, where reputational swings can happen quickly, combining SoS with social listening gives a richer, more accurate understanding of brand momentum.
What does a good share of search report include?
An effective SoS programme should be built on reliable data, consistency, and insight rather than vanity reporting.
Typical components include:
Data collection from robust paid subscription sources
Data cleansing and consolidation
Brand search volume trends vs competitors
Brand + topline category search volume (e.g., “Brand + Product”) vs competitors
Brand share of voice vs competitor set
Category search volume and category share of voice
Social listening mentions vs competitors
This structure ensures you can answer both strategic and operational questions, from “Are we winning the market?” to “Which category needs support next month?”
The key takeaway
Share of search has become one of the most important metrics in 2026 because it is:
Evidence-based, with a strong relationship to market share
Predictive, often acting as a leading indicator of future performance
Competitive, showing how you are performing relative to rivals
Actionable, helping guide budget decisions, category focus, and campaign planning
Most importantly, SoS gives marketers what they need right now: a faster, clearer view of brand momentum, and a practical way to anticipate where the market is heading next.
Are you ready to discover your Share of Search? Contact us at info@mediaworks.co.uk and we will get back to you right away to go over the information we need from you.

